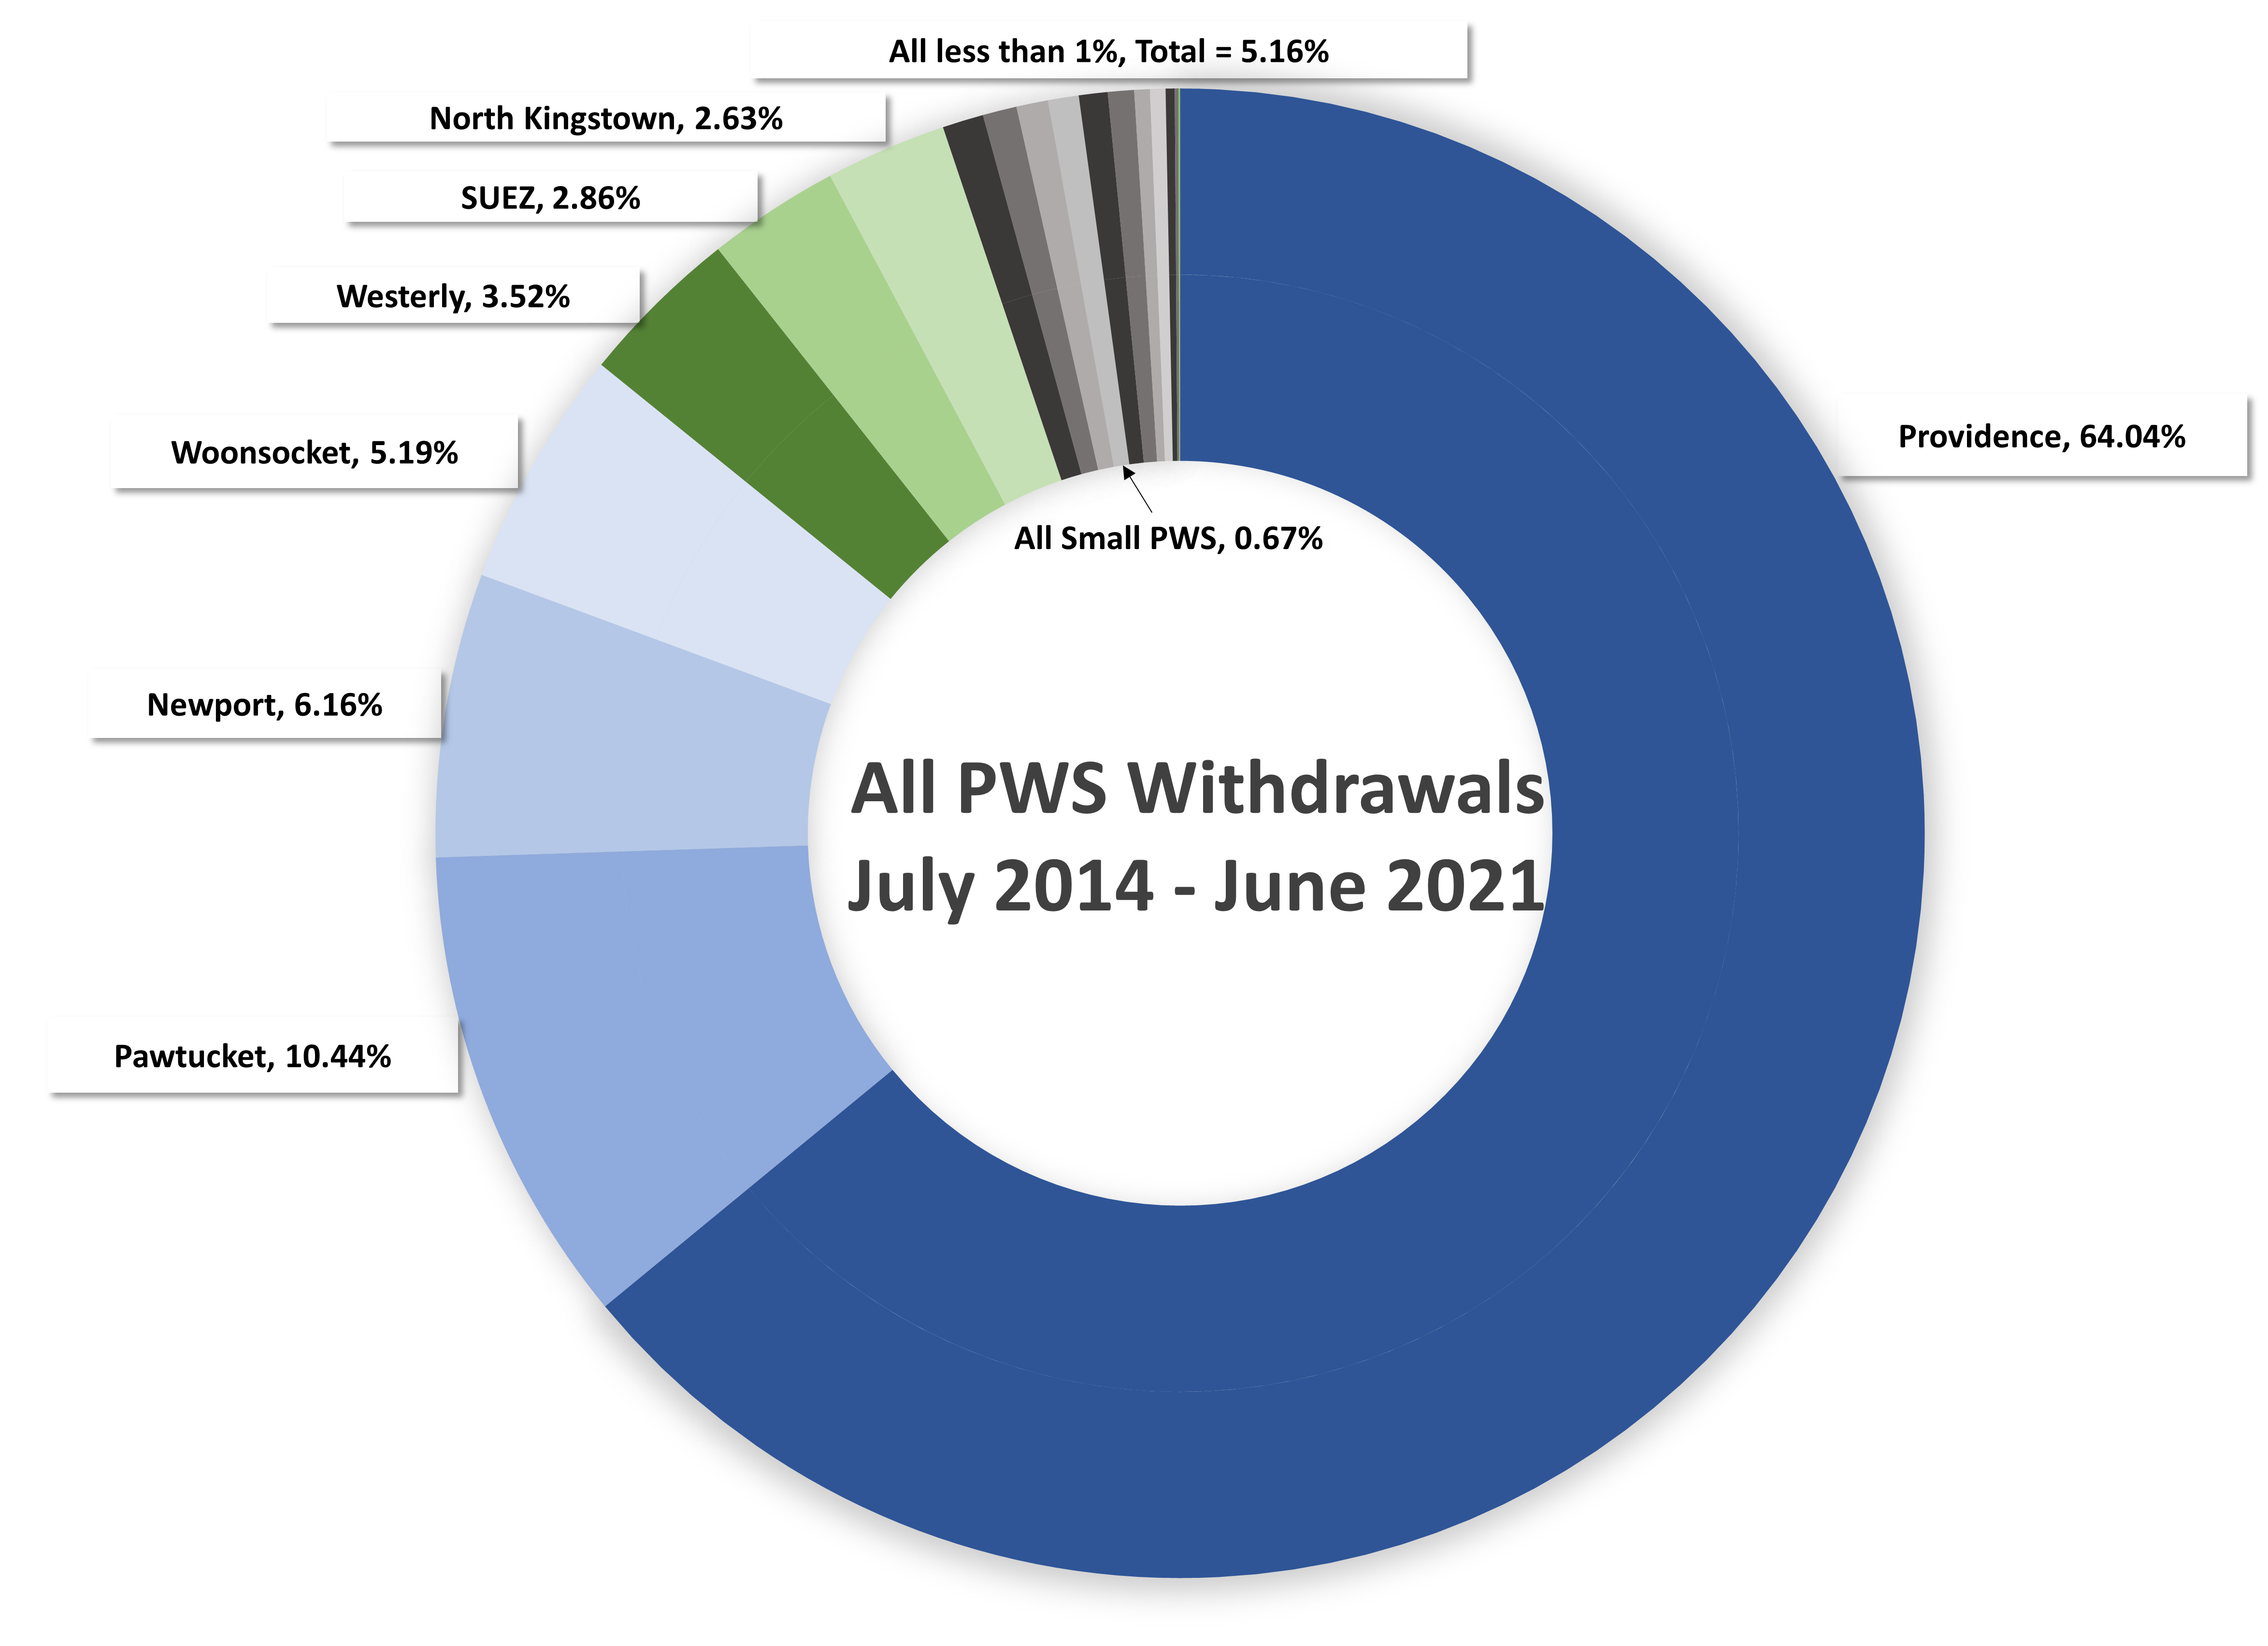
For the seven-year period (7/2014 - 6/2021), total reported withdrawals for the eighteen (18) large suppliers were 246,695 million gallons (99.43%). Total estimated withdrawals for the 436 small PWS was 1,791 million gallons (0.67%). Additional analysis could be done for types of water-users, by supplier, and variations in withdrawals between the larger systems
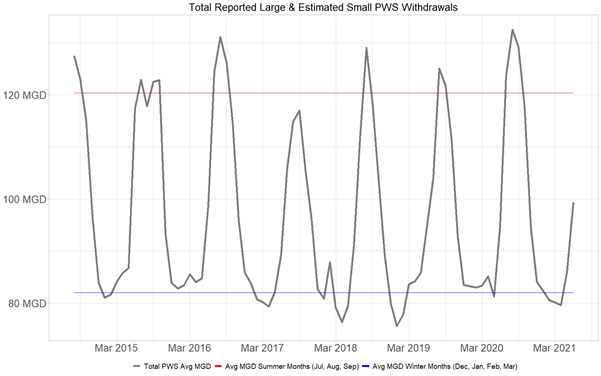
Public water withdrawals vary seasonally and year to year. The WUNDR database provides the ability to compile and analyze long-term trends in statewide water withdrawals.
Accounting for water withdrawals from the natural resources requires the ability to analyze all withdrawals within a watershed. The USGS developed the standardized Hydrologic Unit Codes (HUC) to define watersheds across the United States. The figure below shows all HUC12 watersheds within Rhode Island, and the average monthly PWS withdrawals from July 2014 to June 2021. Utilizing the subwatershed HUC12s to account for all water withdrawals (public supply, private wells, irrigation, etc.) within a basin will allow for future analysis of water availability by HUC12.

A closer look at groundwater withdrawals and how they vary will assist in evaluating impacts on the natural resources. The animated figure below shows monthly PWS groundwater withdrawal trends from July 2014 to June 2021.
Developed by the Rhode Island Water Resources Board in collaboration with the Department of Geosciences at the University of Rhode Island and the Rhode Island Geological Survey. This work was funded through a USGS Water-Use Data and Research Program Grant #G20AC00340. Auxillary data provided by the Rhode Island Department of Health's Safe Drinking Water Information System (SDWIS).